Data
|
|
When do we use Data in real life?
Doctor // Builder // Mechanic // Lawyer // Chef // Chemist // Barista // Teacher // Sales Person
Favourite Sport
Ask students to organise information and then try different categories to see if this changes the result. For example, ask them to write their favourite sport onto a sticky label and then decide how to group the labels to answer the question ‘What is our favourite sport?’ Ask: What does this organisation of the information show? How else could we organise this information? Have them rearrange the sticky labels and then decide whether the new organisation shows something different. Ask: Which organisation best helps us to answer our question?
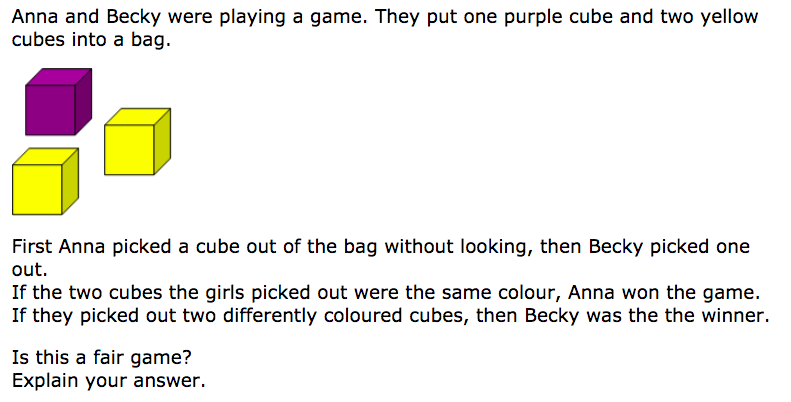
Fair Sample
Invite students to decide if selecting a certain sample would be ‘fair’. For example: We want to find out what sort of sports equipment to buy but only have time to ask 30 students. Should we just ask the boys? Just the Year 6s? What would be a fair sample?
Ask students to organise information and then try different categories to see if this changes the result. For example, ask them to write their favourite sport onto a sticky label and then decide how to group the labels to answer the question ‘What is our favourite sport?’ Ask: What does this organisation of the information show? How else could we organise this information? Have them rearrange the sticky labels and then decide whether the new organisation shows something different. Ask: Which organisation best helps us to answer our question?
Fair Sample
Invite students to decide if selecting a certain sample would be ‘fair’. For example: We want to find out what sort of sports equipment to buy but only have time to ask 30 students. Should we just ask the boys? Just the Year 6s? What would be a fair sample?
Problems?

What are some of the problems we have in our community? What do adults and kids get frustrated about?

|
The dogs next door are always barking!
|
|
People leave their rubbish around
the school and parks! |

|
|
There is no room to play on the playground!
|
WALT: Find out more information about a problem that our class members have using clear questions, categories and ways to record data.
WILF: Respect (whole body listening) and humanity (we celebrate differences)
WILF: Respect (whole body listening) and humanity (we celebrate differences)
Question Box
Have students replace general questions with more specific ones that can be answered using data. For example, ask them to decide which questions from a class question box they would like to answer. Ask: Could we answer this question by collecting data to answer a different question? To find out why dogs bark, we can’t survey dogs, but we could ask dog owners what is happening at the same time as their dog barks. (See Key Understanding 2.)
Have students replace general questions with more specific ones that can be answered using data. For example, ask them to decide which questions from a class question box they would like to answer. Ask: Could we answer this question by collecting data to answer a different question? To find out why dogs bark, we can’t survey dogs, but we could ask dog owners what is happening at the same time as their dog barks. (See Key Understanding 2.)
Cars
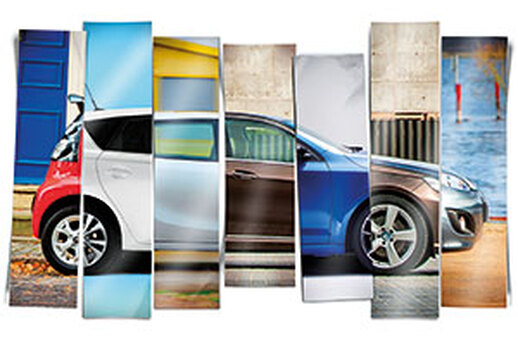
Why do people have different coloured cars?
WALT: Create a tally to record data of the colours of cars in our community?
WILF: Humanity (we are safe) Respect (we follow instructions)
WILF: Humanity (we are safe) Respect (we follow instructions)
Things to consider:
- What time would you expect to have the highest number of cars recorded? How do you know?
- Has everyone recorded their data in the same way?
- Is it better to have lots of categories or only a few?
- Would you expect to have the same results if you went to City Beach on a weekend?
- What time would you expect to have the highest number of cars recorded? How do you know?
- Has everyone recorded their data in the same way?
- Is it better to have lots of categories or only a few?
- Would you expect to have the same results if you went to City Beach on a weekend?
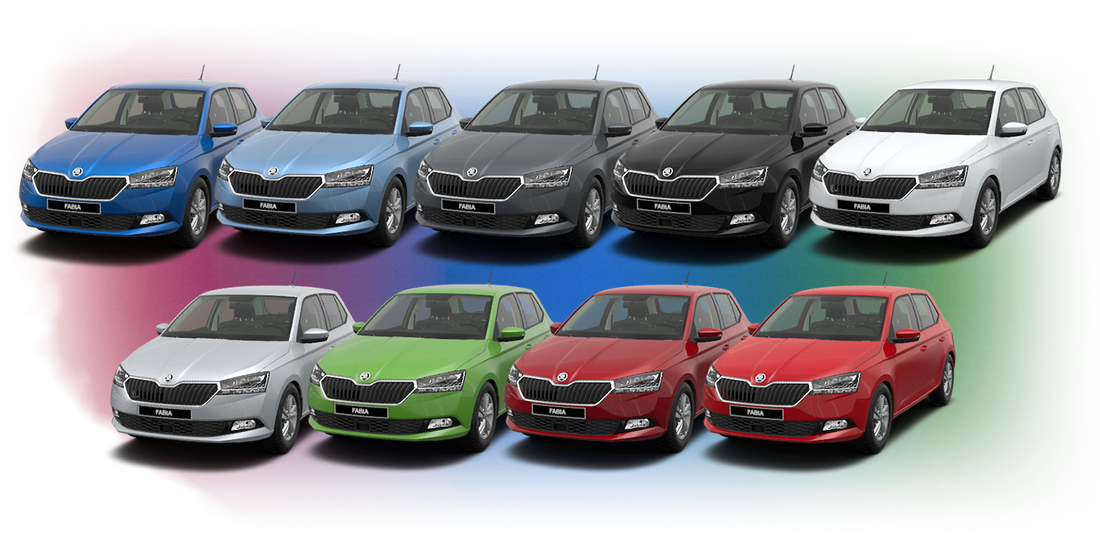
Car Colours
Have students make decisions about ambiguous categories. For example: Ask students to collect data on car colours, then wait a few days and ask them to collect more data on car colours. When ambiguities arise, ask: Who can remember what we did last time? Did we call ‘silver’ grey or blue? How could you have described the categories so you all sort the colours in the same way? Would more categories help avoid having to make difficult decisions?
Have students make decisions about ambiguous categories. For example: Ask students to collect data on car colours, then wait a few days and ask them to collect more data on car colours. When ambiguities arise, ask: Who can remember what we did last time? Did we call ‘silver’ grey or blue? How could you have described the categories so you all sort the colours in the same way? Would more categories help avoid having to make difficult decisions?
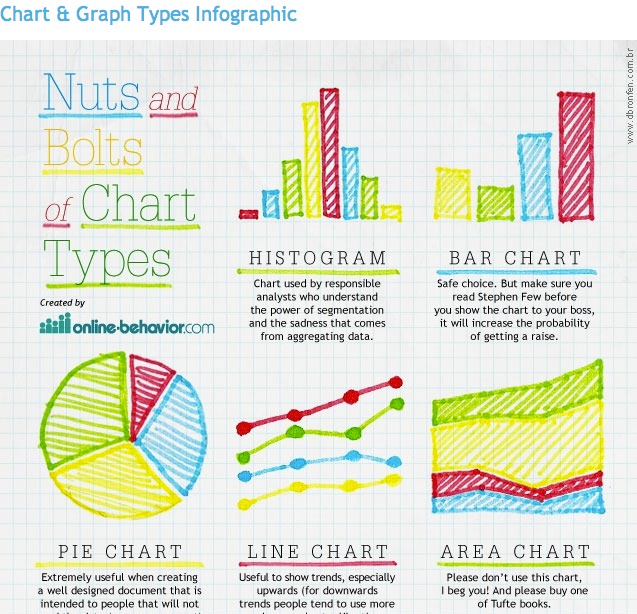
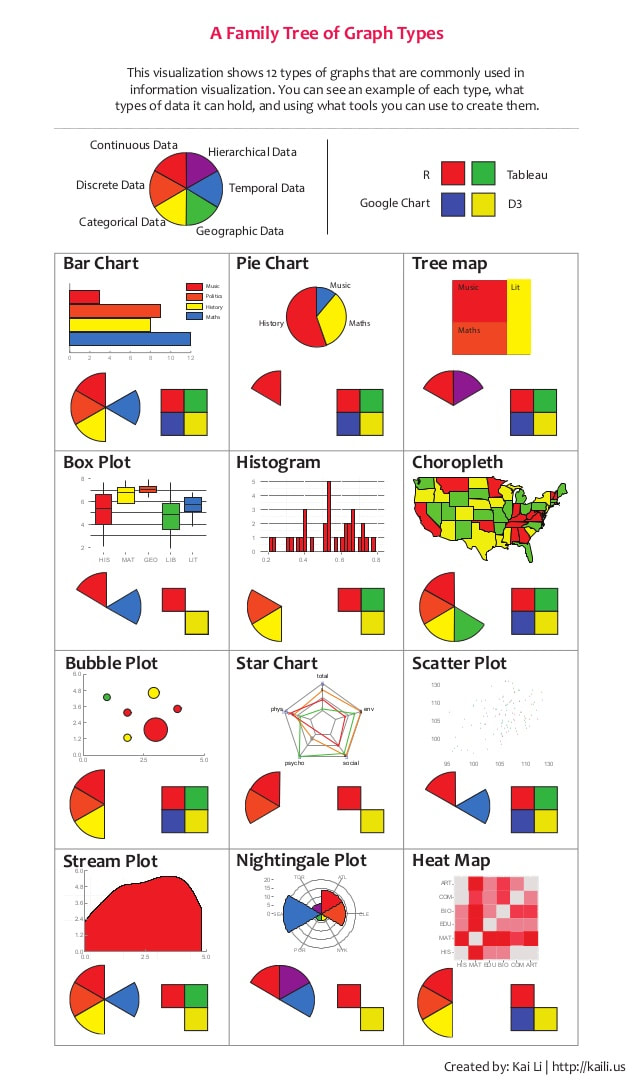
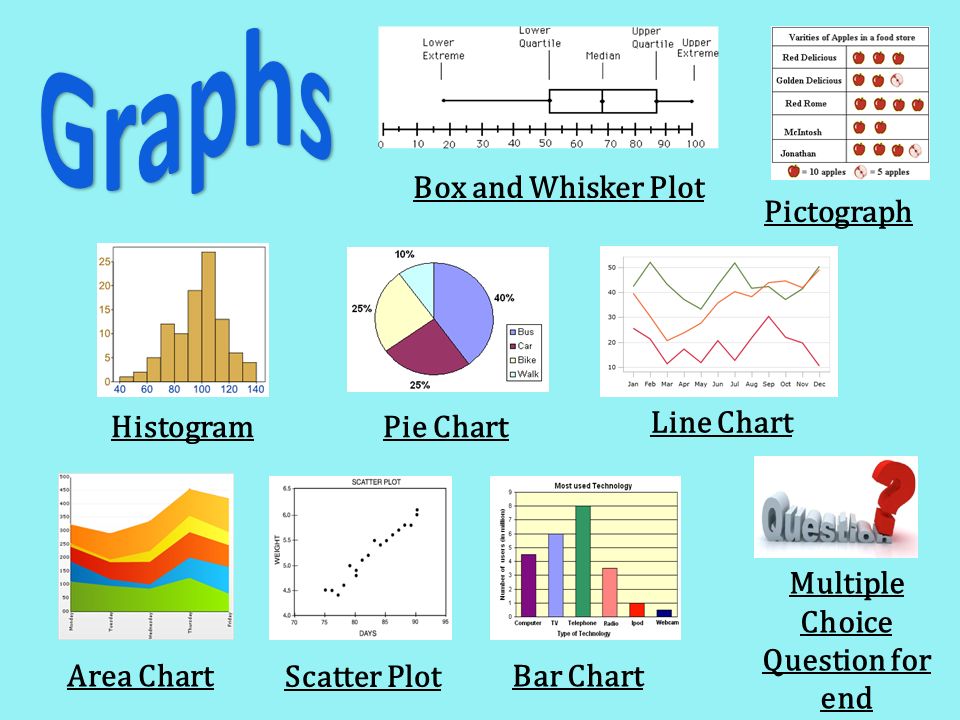
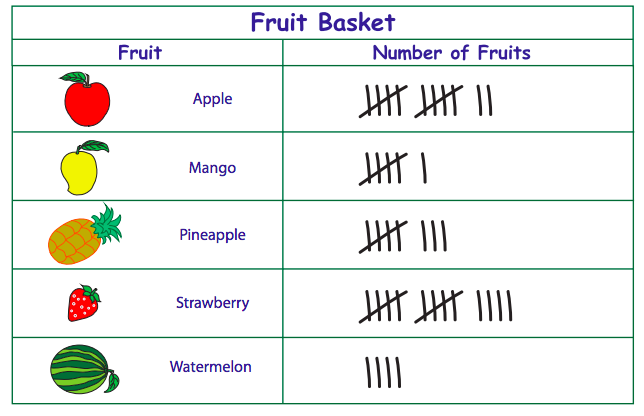
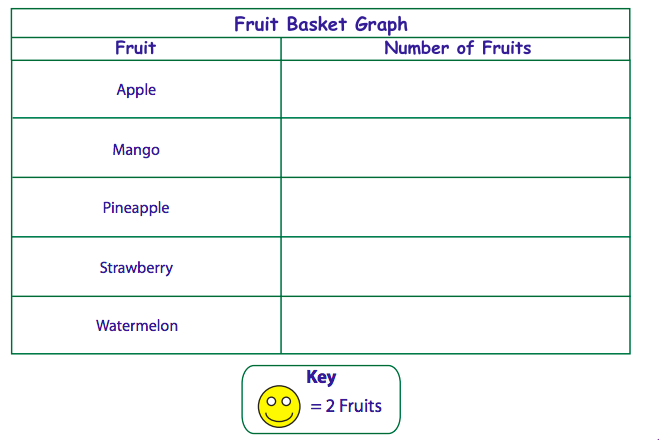
Picture Graphs
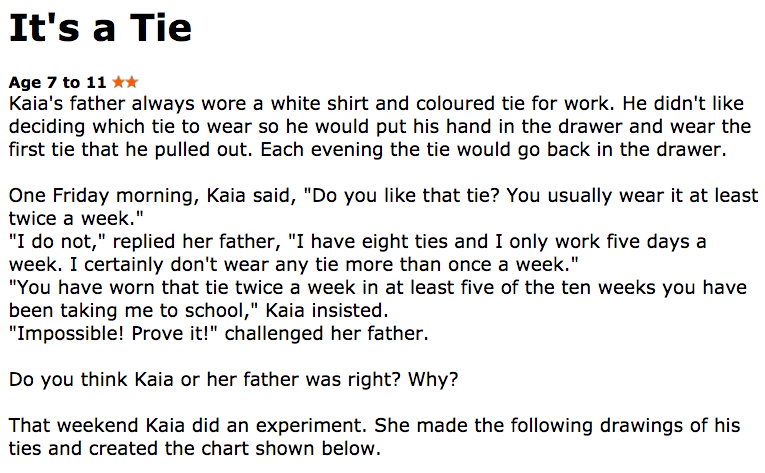
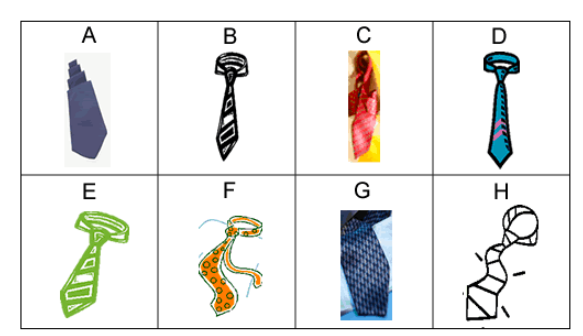
The Tie Challenge
Interpreting Data in a Book
Task on Seesaw
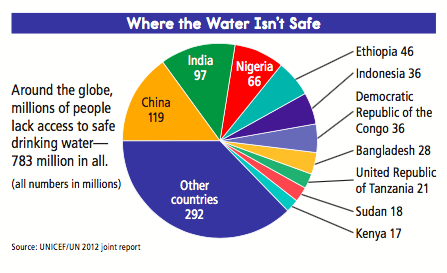
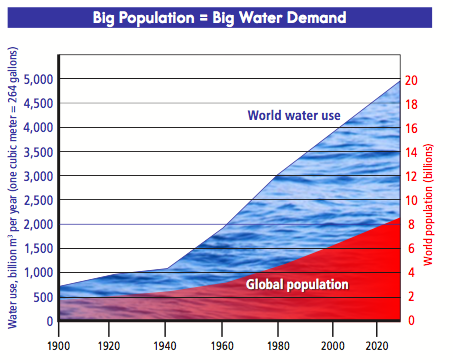
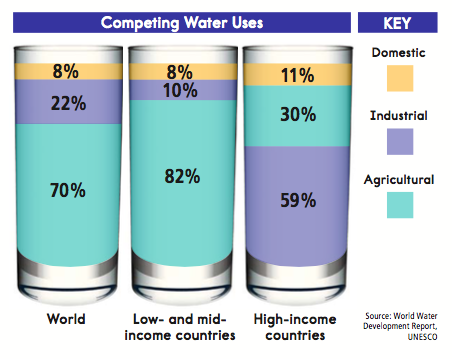
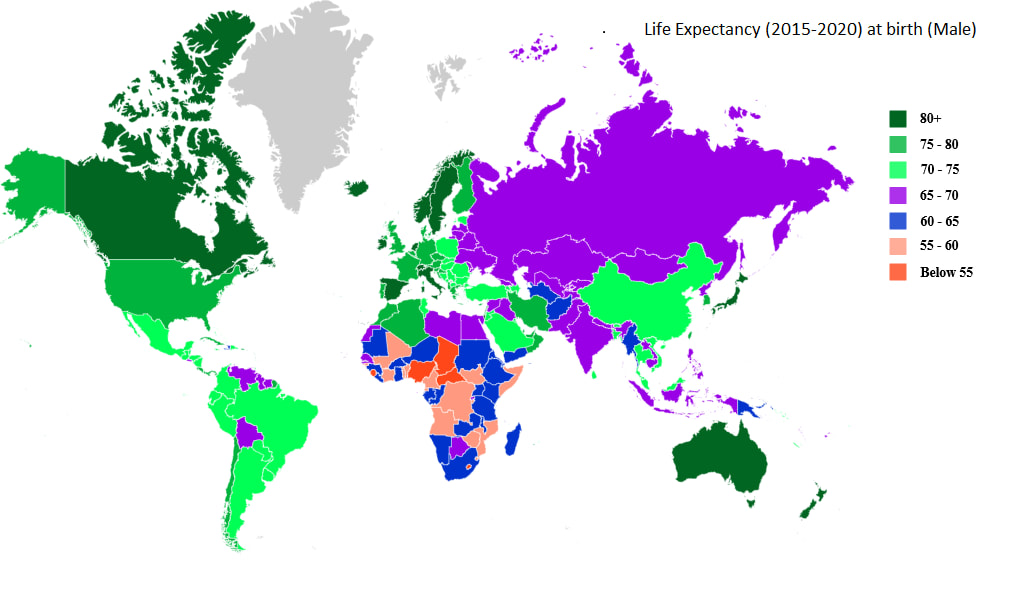
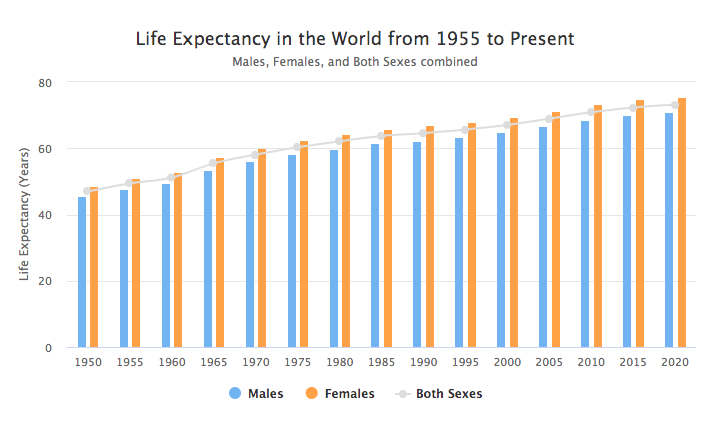
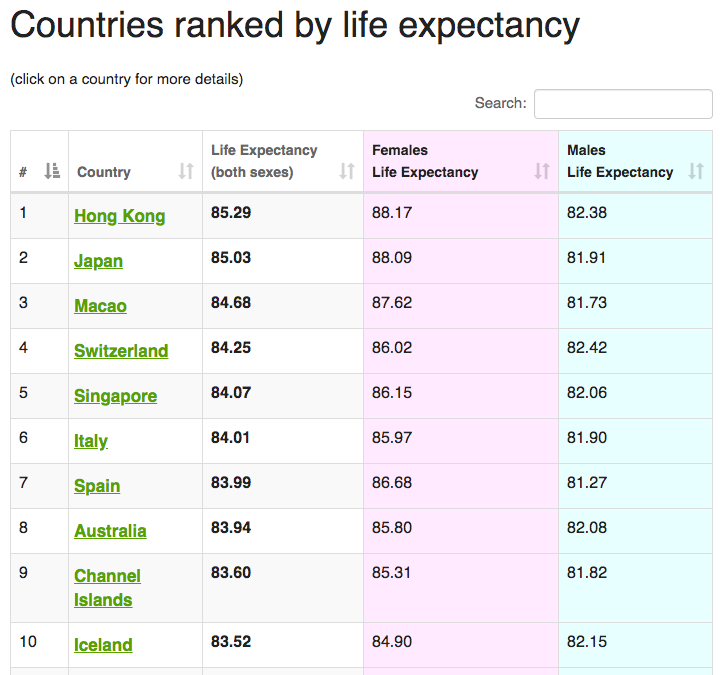
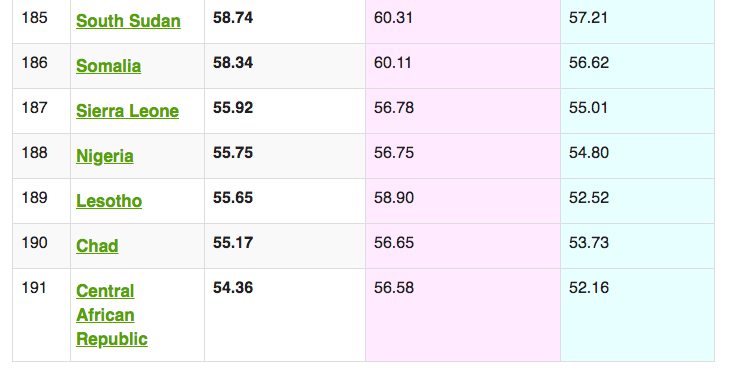
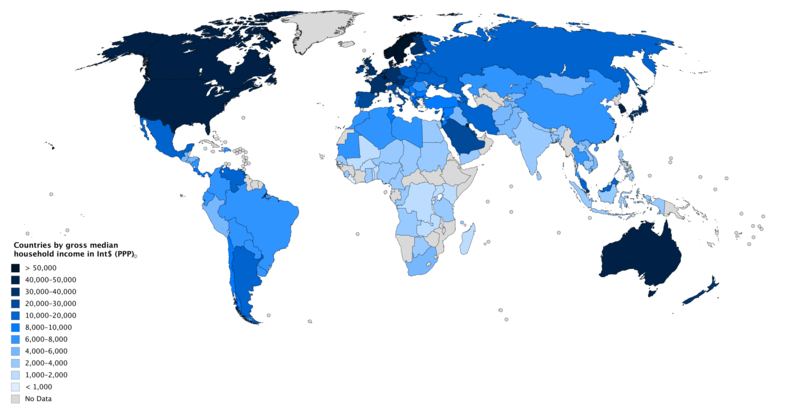
Data of Countries Around the World
WALT: Interpret different versions of the same data.
WILF: You use mathematical language to describe and evaluate the effectiveness of the data displays.
WILF: You use mathematical language to describe and evaluate the effectiveness of the data displays.

|
|
|
Focus Questions:
1. Which set of data is the easiest to understand?
2. Which graph would I look at if I wanted to know about a particular country?
3. Which graph would I look at to see changes over time?
4. Which graph give me the most accurate information?
5. If I wanted to know the life expectancy of a Japanese man, which graph would I look at?
2. Which graph would I look at if I wanted to know about a particular country?
3. Which graph would I look at to see changes over time?
4. Which graph give me the most accurate information?
5. If I wanted to know the life expectancy of a Japanese man, which graph would I look at?
Same or Different?
Tree Diagrams
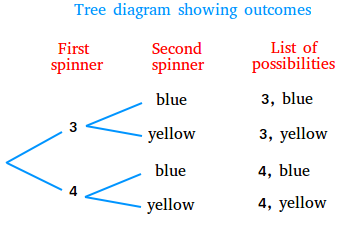
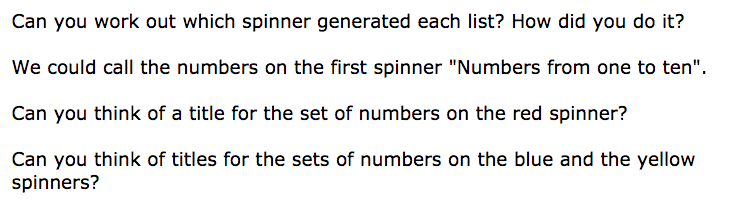
Three Spinners
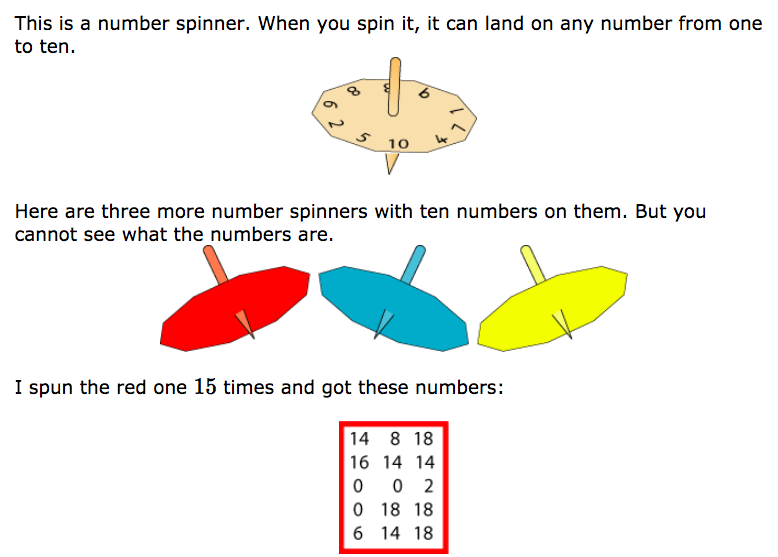
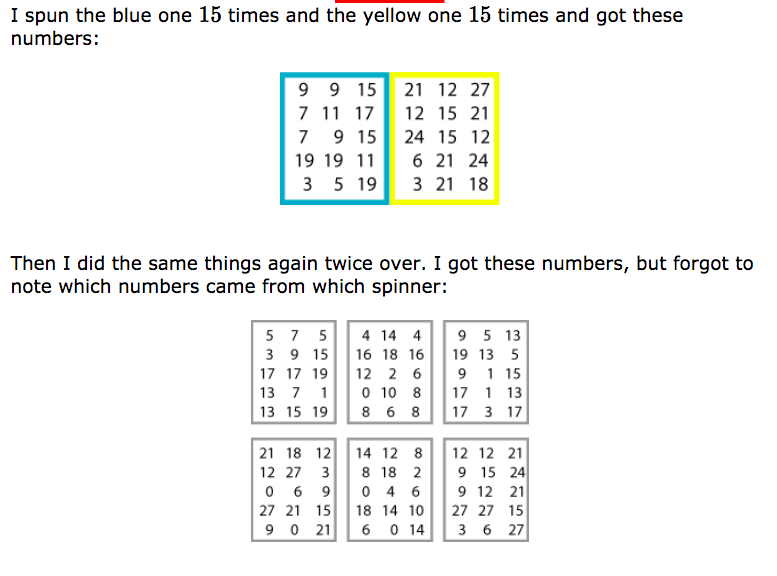
Jake from Seaford Primary described how he tackled this problem:
First I wrote down all the numbers from the red list starting with the smallest. All the numbers were in the 2 times table so I wrote the list again with the missing numbers in.
Then I did the same with the blue and yellow list.
I looked at the other six lists. Some had only 2 times tables so I said they were from the red spinner. Some had only 3 times tables so I said they were from the yellow spinner. Some had only odd numbers so I said they were from the blue spinner.
Ellie did a similar thing:
First of all I wrote down all the numbers you knew were on the red, yellow and blue spinners, as in the tables.
I then checked these over with the tables with no matching colours and saw which ones fitted each.
I filled in the missing numbers which were not in the first three tables and came up with 10 numbers for each colour and titles as well.
RED - even numbers from 0 to 18
BLUE - odd numbers from 1 to 19
YELLOW - multiples of three from 0 up to 27
