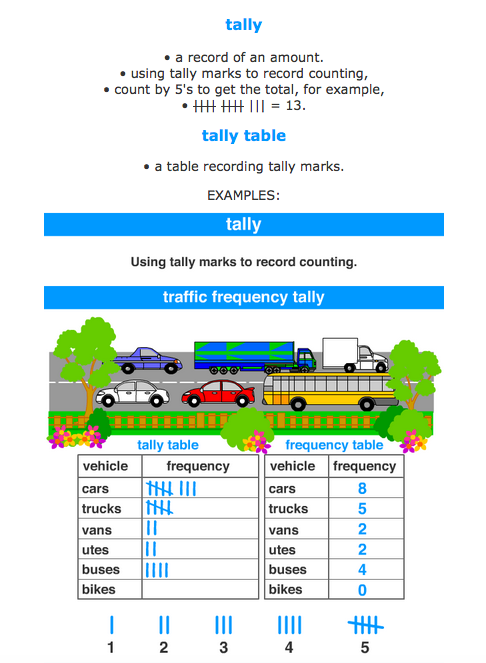
Understanding how to Tally
Line Start Here...

|
|
Questions:
1. How many people like Apple Juice?
2. How is the information presented differently for Drinks and Favorite Pets?
3. Create a tally of how your group they arrived at school today.
Extension:
1. How many people like Apple Juice?
2. How is the information presented differently for Drinks and Favorite Pets?
3. Create a tally of how your group they arrived at school today.
Extension:
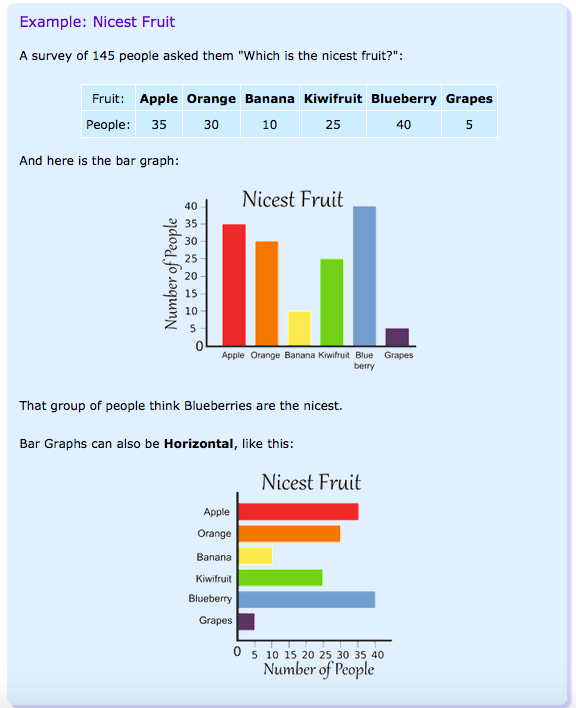
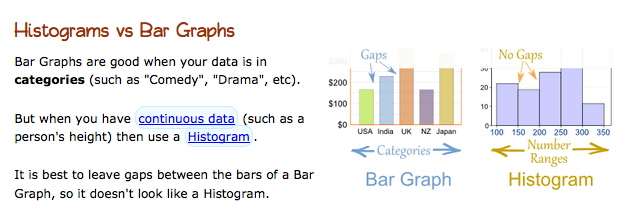
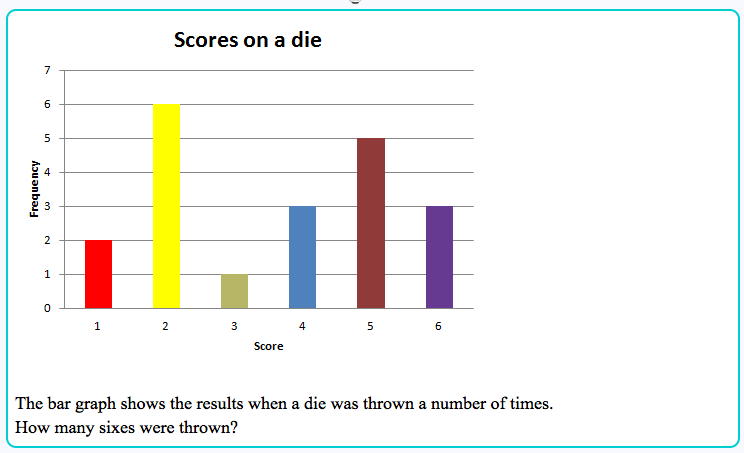
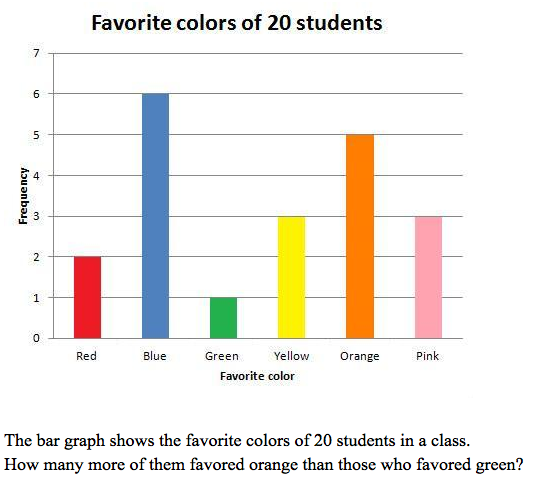
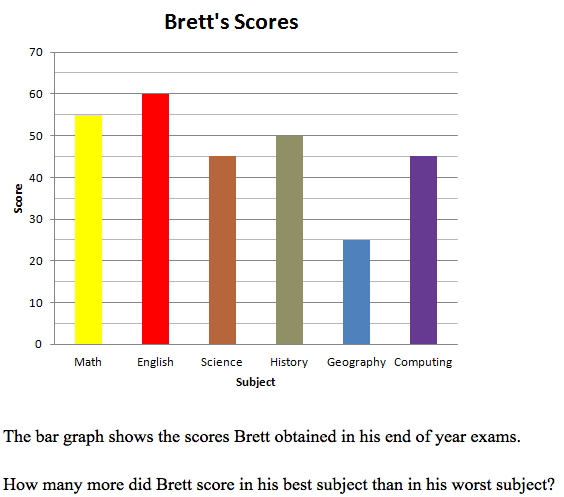
Reading and understanding Bar Graphs
Tally and Pictograph Start here:
Collecting Data and imputing into a Bar Graph
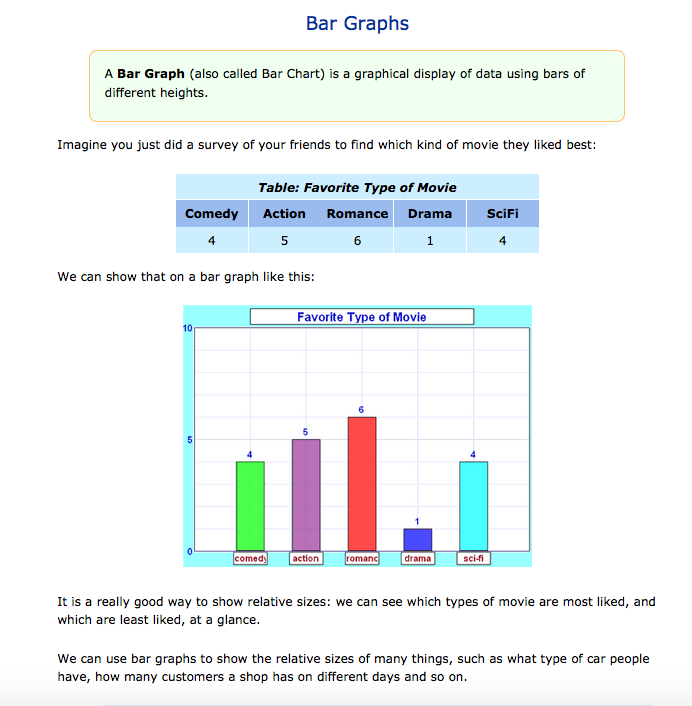
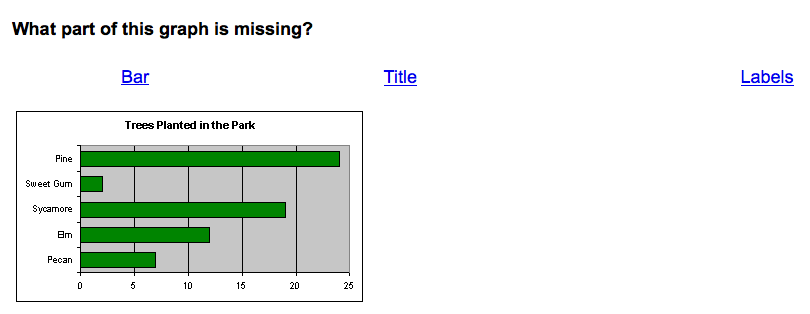
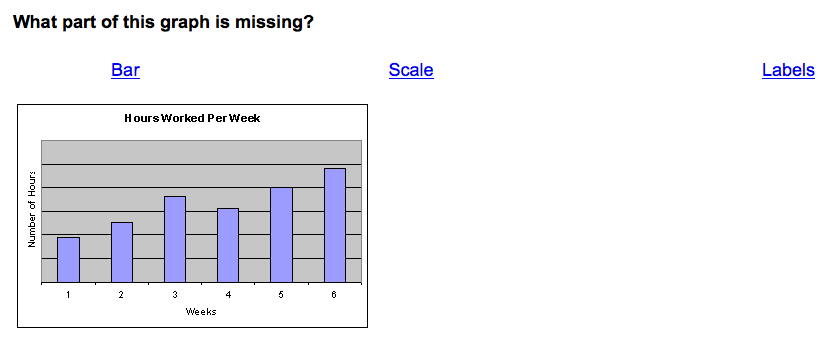
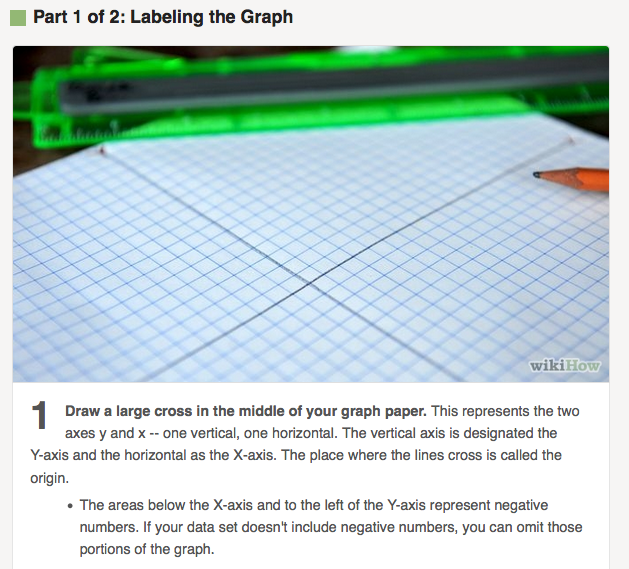
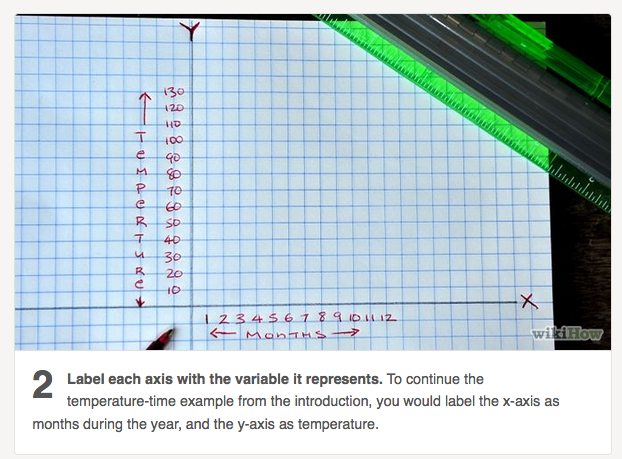
Bar Graph Start Here
Now that you know what a Bar Chart/Graph is, you need to ensure that when you create one, it includes the following items:
1. Title
2. Label on the y axis (vertical)
3. Scale on the y axis
4. Label on the x axis (horizontal)
5. Items/categories on the x axis
6. Bars that are created using a ruler and are slightly spaced apart.
Lets see if you can score 6/6 for your graph!
Task:
1. As a group, you are going to vote on which of the following you would like to know:
- your group's favourite subject at school
- what mode of transport was used to arrive at school
- your group's favourite colour
- how many days they exercise a week for more than 30 minutes (does this include physical education with Mr P and senior sport?)
2. Conduct a survey of 10 people and tally your results.
3. Construct your Bar Graph making sure you follow all six criteria.
Extension:
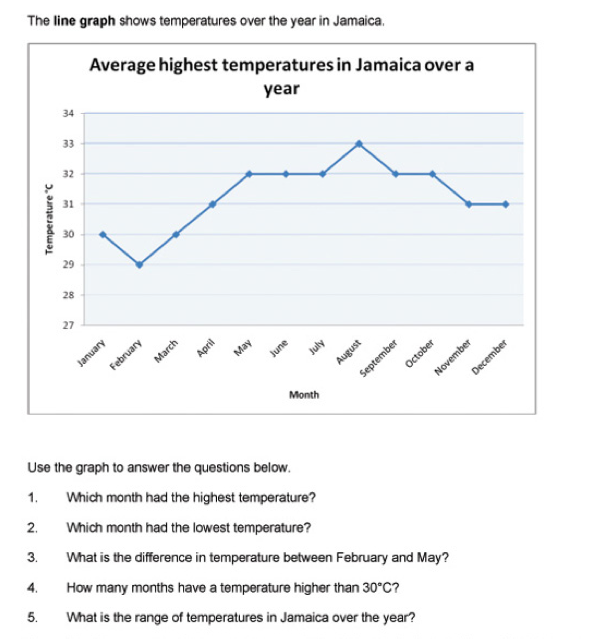
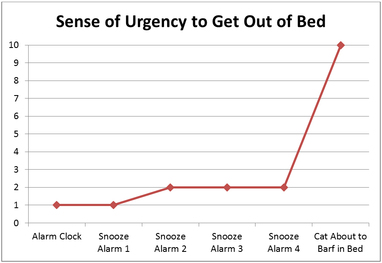
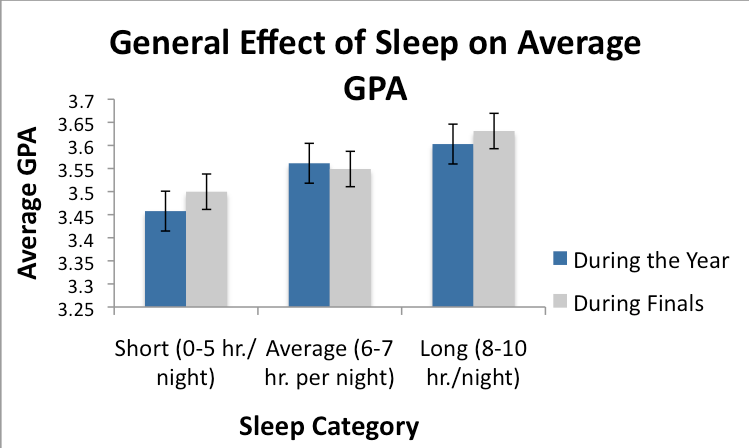
Reading and Understanding Line Graphs

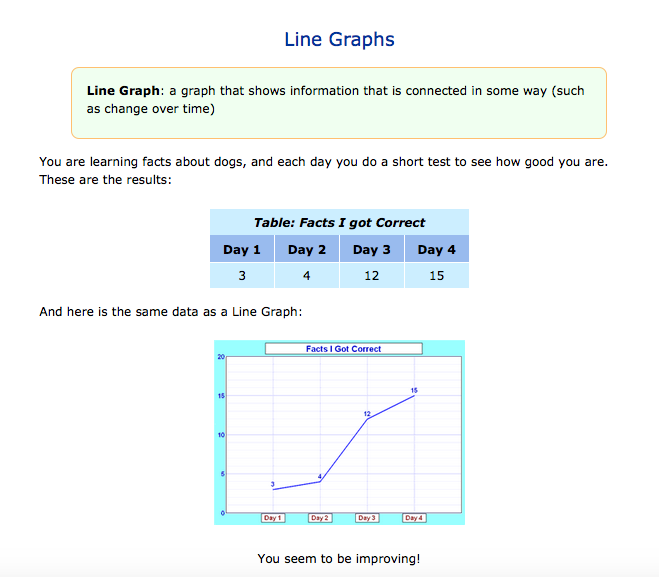
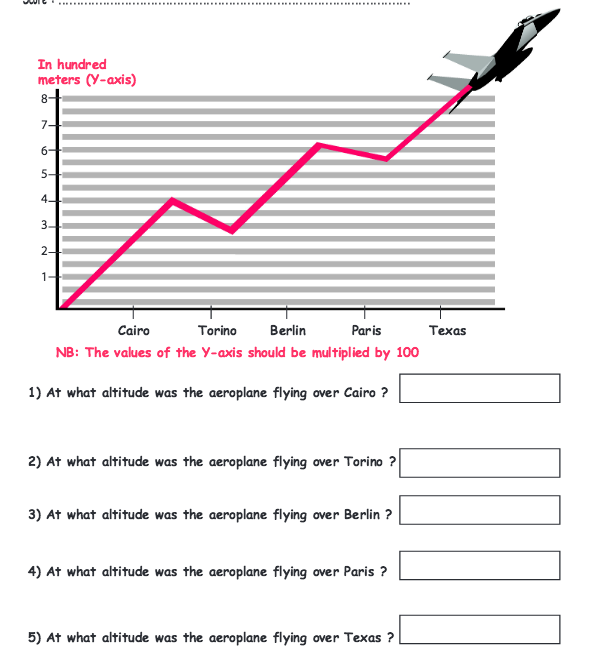
Collecting Data and imputing into a Line Graph
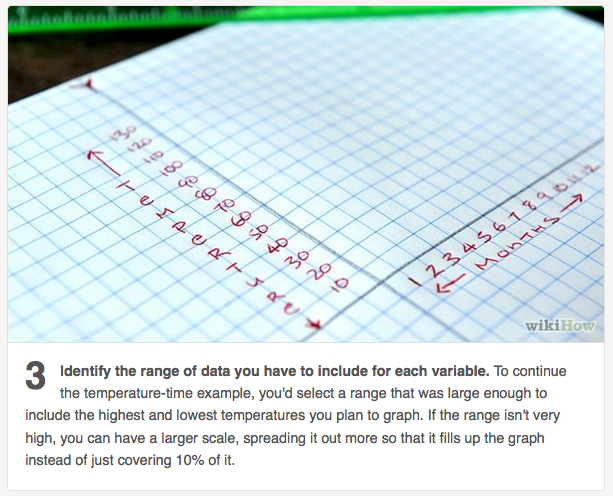
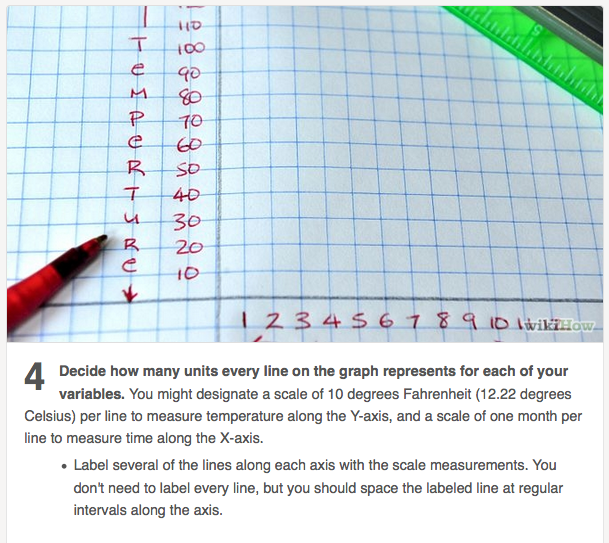
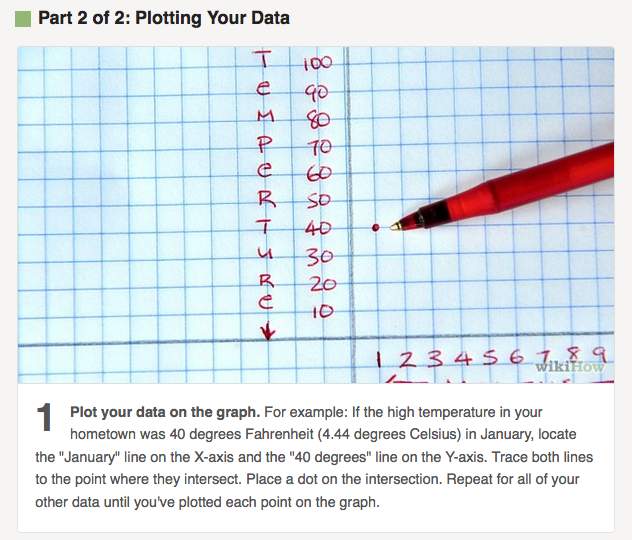
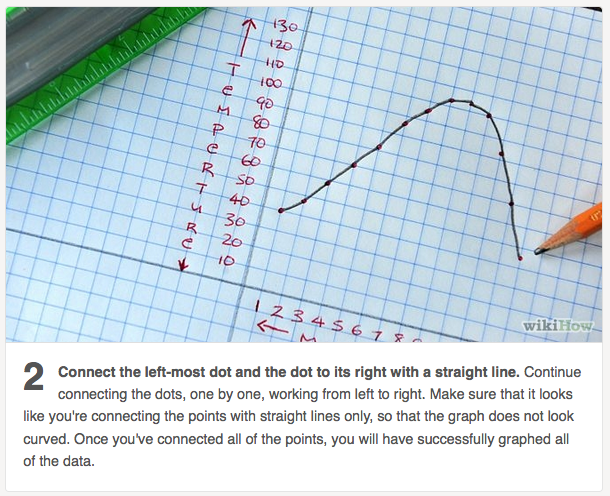
As a group, decide on which of the following two you are going to record:
- distance of a standing start jump
- hand span
- circumference of head
- circumference of wrist
- length of thumb
- distance from shoulder to elbow
Is there a connection between your data? Plot your data on a line graph.
- distance of a standing start jump
- hand span
- circumference of head
- circumference of wrist
- length of thumb
- distance from shoulder to elbow
Is there a connection between your data? Plot your data on a line graph.
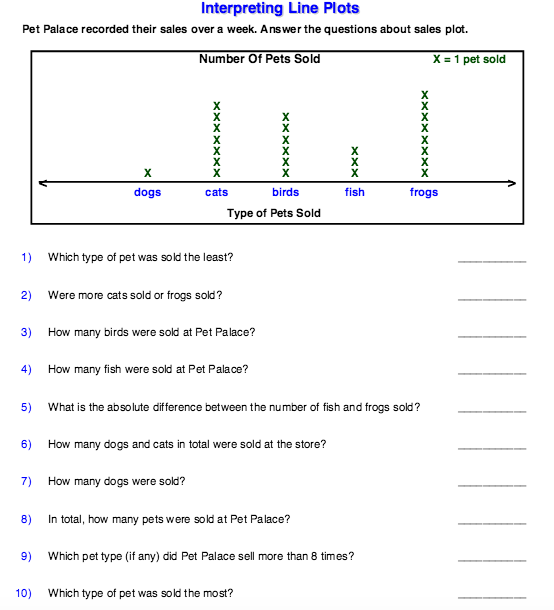
Line/dot plots
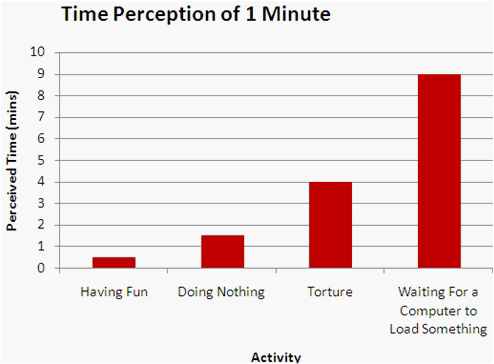
Comparing different graphs to make decisions

Sometimes you will need to look at a number of different types of data, understand what each graph is communicating and how to use that to answer a specific question. This includes understanding what data is important, what data is irrelevant and how you will explain your understanding.
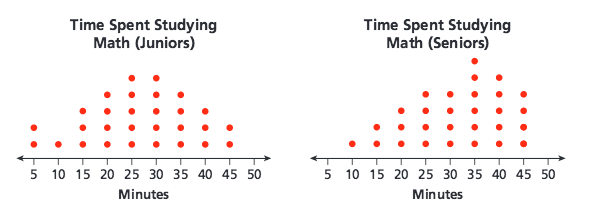
Question: A student is about to start High School (Juniors) and wants to wants to know how much he should study a night. Interpret the following data and explain your recommendations with evidence.
Question: A student is about to start High School (Juniors) and wants to wants to know how much he should study a night. Interpret the following data and explain your recommendations with evidence.
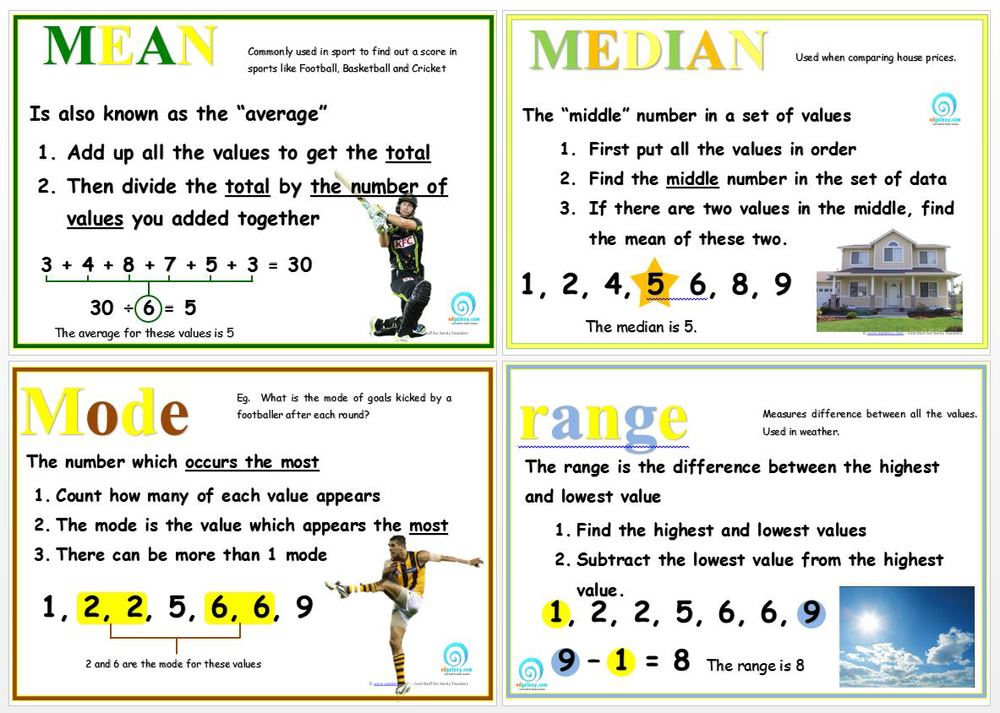
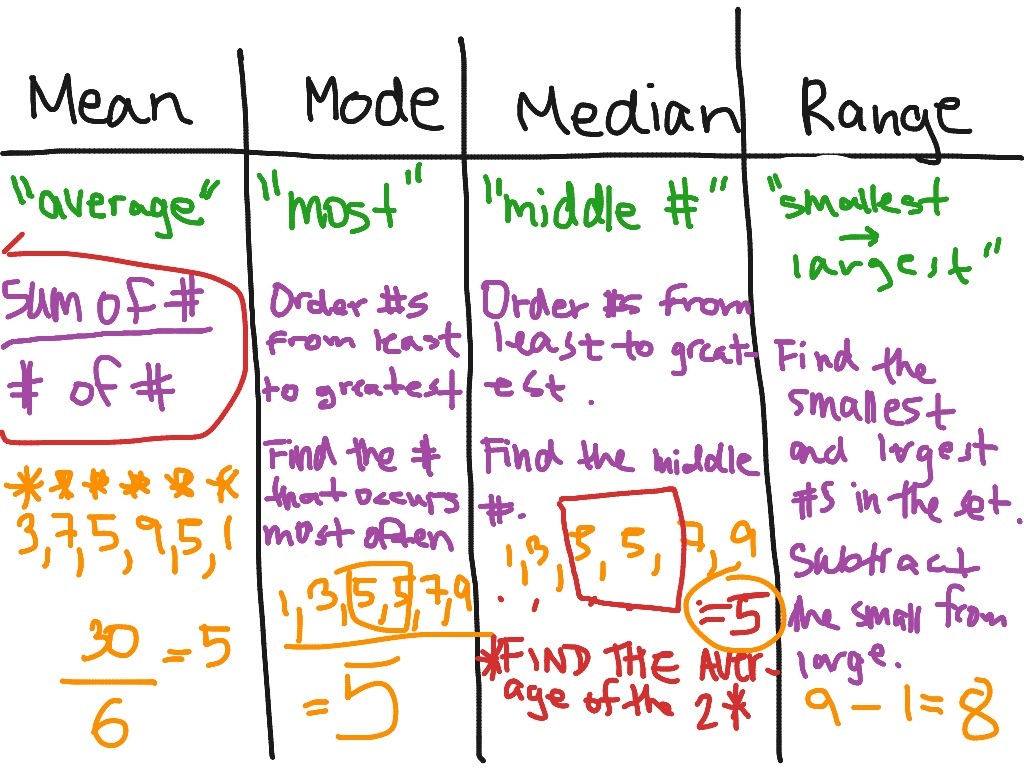
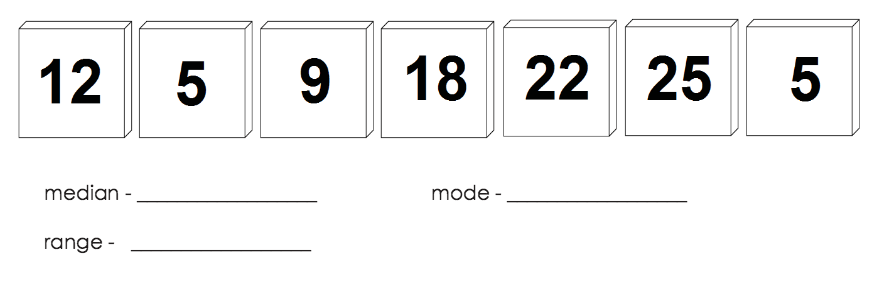
The language of Data
An average kind of song from a kind of awesome teacher....
A cute kind of song...
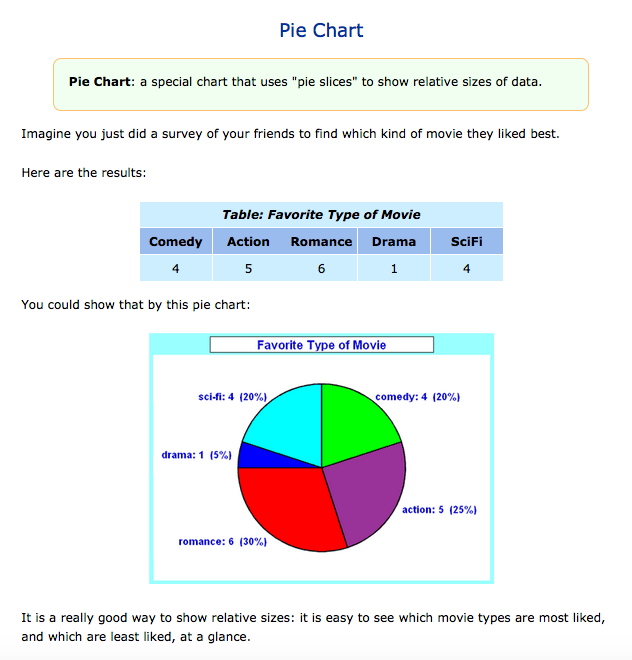
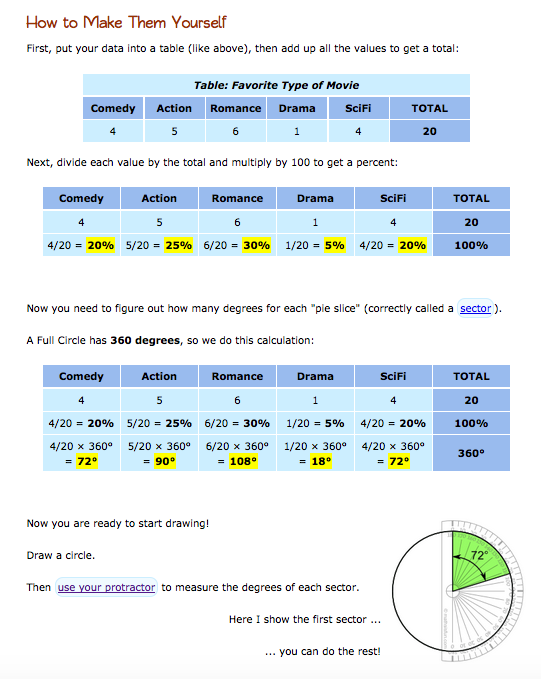
Pie Graphs
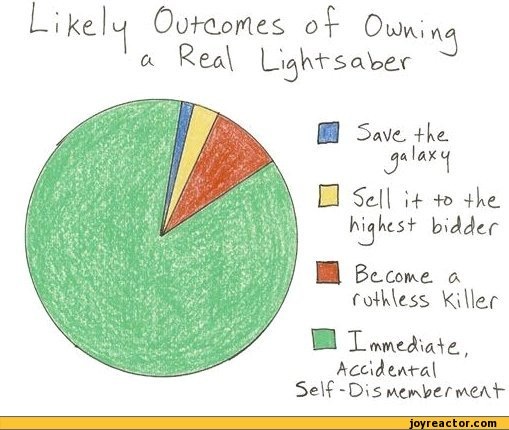
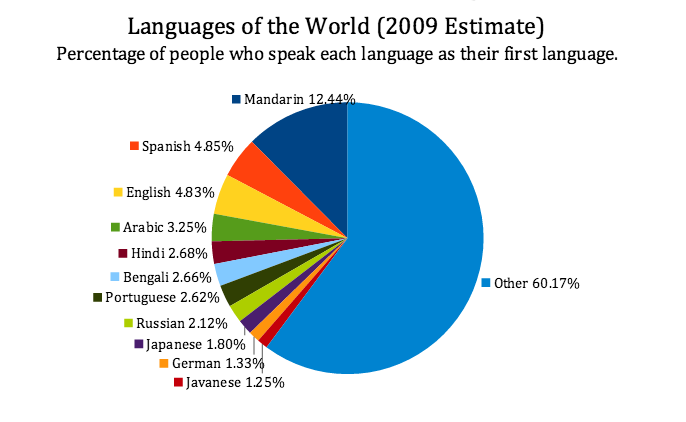
Create three quiz questions for someone in your group to answer based on the pie chart above.
